
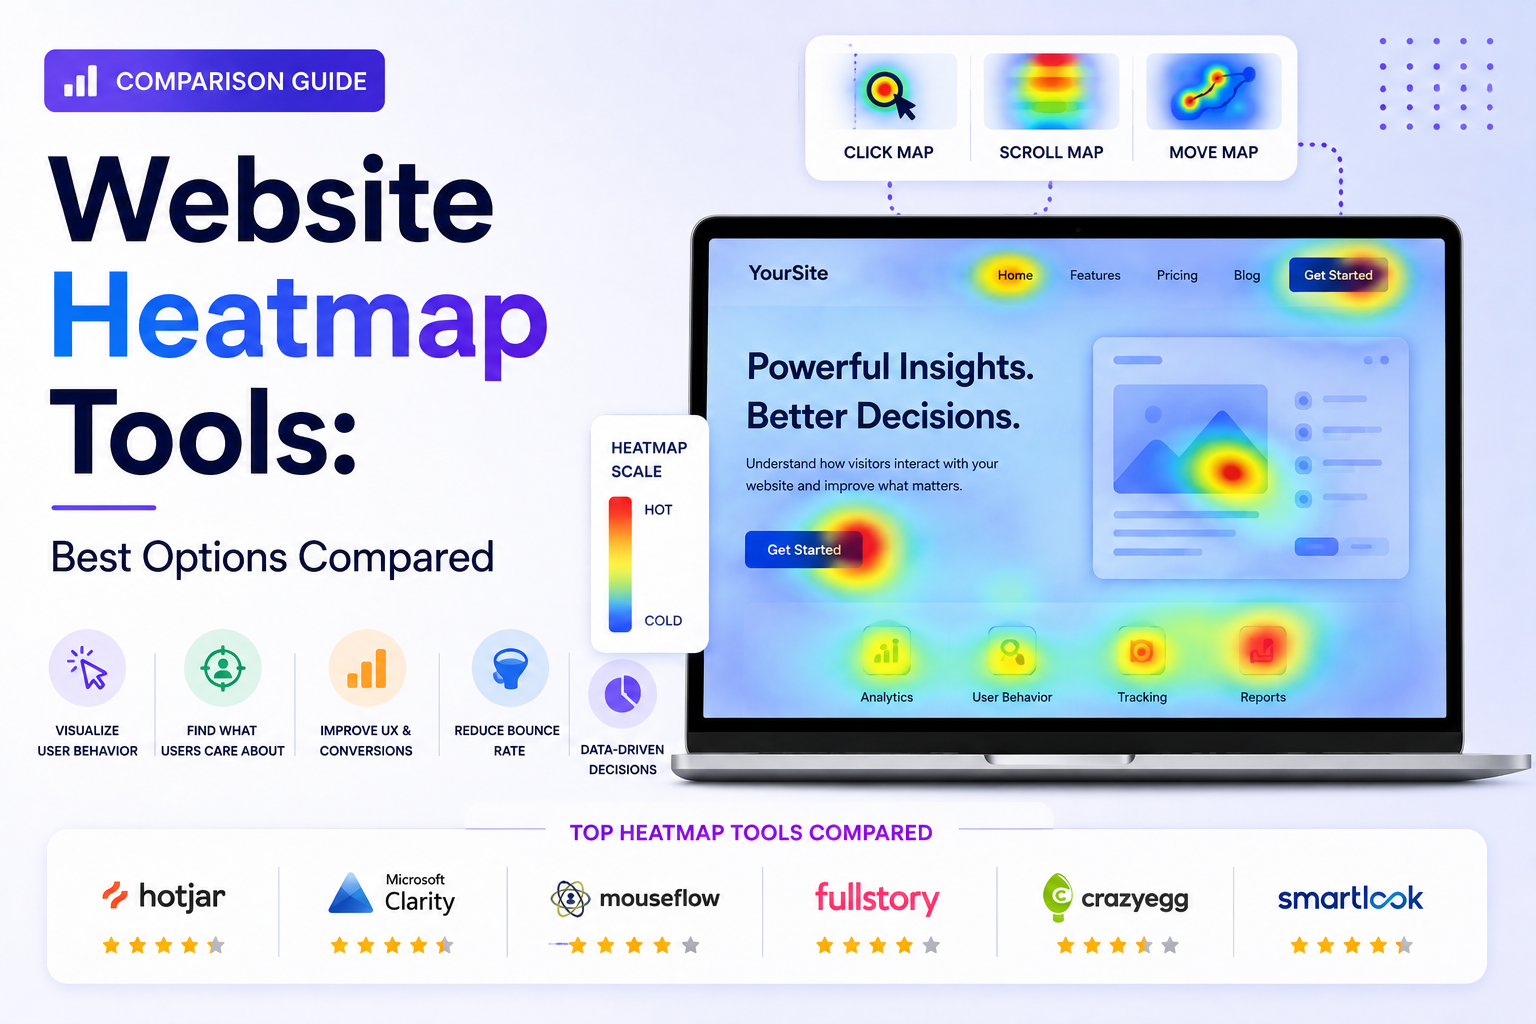
Analytics tools tell you what happened on your website — page views, bounce rate, conversion rate — but not why. Heatmap tools fill that gap, visually revealing how visitors actually interact with a page: where they click, how far they scroll, and where their attention concentrates. This guide compares leading heatmap tools, explains the different types of heatmap data available, and covers how to use this data effectively to drive real optimization decisions.
What Heatmap Tools Actually Show You
Click Maps
Click maps visually overlay where visitors click on a page, using color intensity to show concentration — red/orange for high-click areas, blue/green for low-click areas. This often reveals surprising patterns: visitors clicking on elements that aren’t actually interactive (suggesting a design that misleadingly implies clickability), or a call-to-action receiving far fewer clicks than its visual prominence would suggest it should.
Scroll Maps
Scroll maps show what percentage of visitors reach each vertical section of a page, typically displayed as a gradient from where 100% of visitors start (the top) down to wherever engagement drops off. This is critical for understanding whether important content — pricing, key value propositions, calls-to-action — is actually being seen by most visitors or is buried below a scroll depth most people never reach.
Move Maps (Mouse Tracking)
Move maps track cursor movement across the page as a proxy for visual attention, based on research suggesting a meaningful (though imperfect) correlation between mouse position and eye movement, particularly on desktop. This data is generally considered less reliable than click and scroll data but can still surface useful directional insight.
Session Recordings
Beyond aggregate heatmap data, most modern tools also offer individual session recordings — actual playback of a single visitor’s browsing session, including mouse movement, clicks, and scrolling in real time. This is particularly valuable for diagnosing specific usability problems (a confusing form, an unexpected error) that aggregate heatmap data alone might not fully explain.
Leading Heatmap Tools Compared
Hotjar
Hotjar is one of the most widely used heatmap and behavior analytics tools, combining click/scroll/move heatmaps with session recordings, on-site surveys, and feedback widgets in a single platform. Its accessible pricing and straightforward setup make it a popular default choice for small to mid-sized businesses getting started with behavioral analytics.
Microsoft Clarity
Clarity is a free heatmap and session recording tool from Microsoft, offering genuinely full-featured functionality — including heatmaps, session recordings, and basic analytics — at no cost, making it one of the most accessible entry points into behavioral analytics for businesses without budget for a paid tool.
Crazy Egg
Crazy Egg is a long-established heatmap tool with a strong focus specifically on conversion optimization, offering heatmaps, A/B testing, and a specific “confetti” report that segments click data by traffic source — useful for understanding whether different acquisition channels behave differently on the same page.
FullStory
FullStory positions itself as a more comprehensive “digital experience analytics” platform beyond basic heatmaps, with deep session replay, funnel analysis, and technical error tracking, generally aimed at larger organizations with more complex analytics needs and correspondingly higher pricing than simpler heatmap-focused tools.
Mouseflow
Mouseflow offers heatmaps, session recordings, and funnel/form analytics with a particular emphasis on form abandonment tracking — identifying exactly which form fields cause visitors to abandon a signup or checkout flow, which is a common and high-impact conversion optimization insight.
Lucky Orange
Lucky Orange combines heatmaps and session recordings with live chat and on-site polling in a single platform, appealing to smaller e-commerce and service businesses wanting behavioral analytics and visitor communication tools together rather than as separate subscriptions.
Free vs. Paid Heatmap Tools
Microsoft Clarity stands out as a genuinely full-featured free option, making it a reasonable starting point even for businesses that later upgrade to a paid tool for additional features like A/B testing integration or more advanced segmentation. Most other tools on this list offer limited free tiers primarily as a trial mechanism, with meaningful functionality gated behind paid plans — worth confirming exactly what’s included at each pricing tier before assuming free-tier functionality will cover your actual analysis needs.
How to Use Heatmap Data Effectively
Start With a Specific Question
Rather than passively browsing heatmap data, start optimization work with a specific question: “Are visitors seeing our pricing section?” or “Why is our signup form abandonment rate high?” — and use the relevant heatmap data type (scroll map, form analytics) to answer that specific question.
Segment by Traffic Source and Device
Behavior often differs significantly between traffic sources (paid search visitors behave differently than organic or referral visitors) and devices (mobile scroll behavior differs substantially from desktop). Aggregate heatmap data across all traffic can mask important differences that segmented analysis would reveal.
Combine Heatmaps With Analytics Data
Heatmap tools show behavior; analytics platforms show outcomes (conversion rate, bounce rate). Combining both — for example, correlating high-bounce pages with heatmap data showing where visitors’ attention goes before leaving — produces more actionable insight than either data source alone.
Turn Insights Into Testable Hypotheses
Heatmap data is diagnostic, not prescriptive — it tells you what’s happening, not definitively why or what to change. Use heatmap insights to generate specific, testable hypotheses (via A/B testing) rather than making permanent page changes based on heatmap observation alone.
Common Heatmap Analysis Mistakes
- Drawing conclusions from too little traffic — heatmap data needs sufficient visitor volume to be statistically meaningful, particularly for lower-traffic pages
- Ignoring device segmentation — mobile and desktop heatmaps often tell very different stories, and combining them into a single view can obscure important patterns
- Treating heatmap data as definitive rather than diagnostic — heatmaps reveal patterns worth investigating further, not final answers about what changes will improve conversion
- Not revisiting heatmap data after making changes — heatmap analysis should be an ongoing part of the optimization cycle, not a one-time diagnostic exercise
Privacy and Compliance Considerations
Heatmap and session recording tools capture detailed visitor behavior data, which carries privacy implications under regulations like GDPR and CCPA. Most reputable heatmap tools offer built-in features to mask or exclude sensitive form fields (payment information, passwords) from session recordings automatically, and it’s important to confirm this masking is properly configured, along with ensuring your site’s privacy policy and cookie consent mechanisms accurately reflect the behavioral tracking taking place.
Frequently Asked Questions
What is the best free heatmap tool? Microsoft Clarity is widely regarded as the strongest free option, offering genuinely full-featured heatmaps and session recordings at no cost, unlike most competitors that gate meaningful functionality behind paid tiers.
Is Hotjar or Crazy Egg better? Hotjar generally offers a broader combined feature set (heatmaps, recordings, surveys, feedback widgets) at accessible pricing, while Crazy Egg has a more specific focus on conversion optimization with features like its traffic-source-segmented click reports. The better choice depends on whether you need the broader behavioral analytics suite or a more CRO-focused tool specifically.
Do heatmap tools slow down my website? Reputable heatmap tools are built to minimize performance impact through asynchronous loading, but any additional tracking script adds some load time, so it’s worth testing page speed impact after installation and ensuring the script is implemented correctly (typically asynchronously) rather than blocking page render.
Can heatmaps show data for mobile visitors? Yes, most modern heatmap tools support mobile-specific heatmaps and session recordings, and it’s important to review mobile data separately from desktop, since scroll and interaction patterns often differ significantly between device types.
Are heatmap tools GDPR compliant? Most established heatmap tools offer GDPR-compliant configurations, including features to mask sensitive form data and support for cookie consent integration, but compliance ultimately depends on your specific implementation and privacy policy, not just the tool’s built-in capabilities alone.
How much traffic do I need before heatmap data becomes useful? There’s no strict minimum, but pages with very low traffic will take longer to accumulate a heatmap pattern reliable enough to draw conclusions from — for low-traffic pages, session recordings (reviewing individual sessions) are often more immediately useful than aggregate heatmap visualizations.