Landing Page Optimization: A/B Testing, UTM Tracking & Heatmaps
A landing page’s job is singular: convert a visitor into a lead, signup, or customer. Yet most landing pages are built once and never meaningfully improved afterward, leaving significant conversion rate gains on the table. Landing page optimization is the ongoing, data-driven process of testing, measuring, and refining a page based on actual visitor behavior — not guesswork or internal opinion about what “looks good.”
This guide covers the three pillars of landing page optimization: A/B testing methodology, UTM tracking for attribution, and heatmap analysis for behavioral insight, along with a practical framework for running an effective optimization program.
Why Landing Page Optimization Matters
Even small improvements in conversion rate compound significantly at scale. A page converting at 2% versus 3% doesn’t sound dramatic in isolation, but across meaningful traffic volume, that’s a 50% increase in leads or sales from the exact same ad spend and traffic — no additional acquisition cost required. This is why conversion rate optimization (CRO) consistently delivers some of the highest ROI available in a marketing budget, since it improves the output of traffic you’re already paying to acquire.
A/B Testing Landing Pages
What A/B Testing Actually Tests
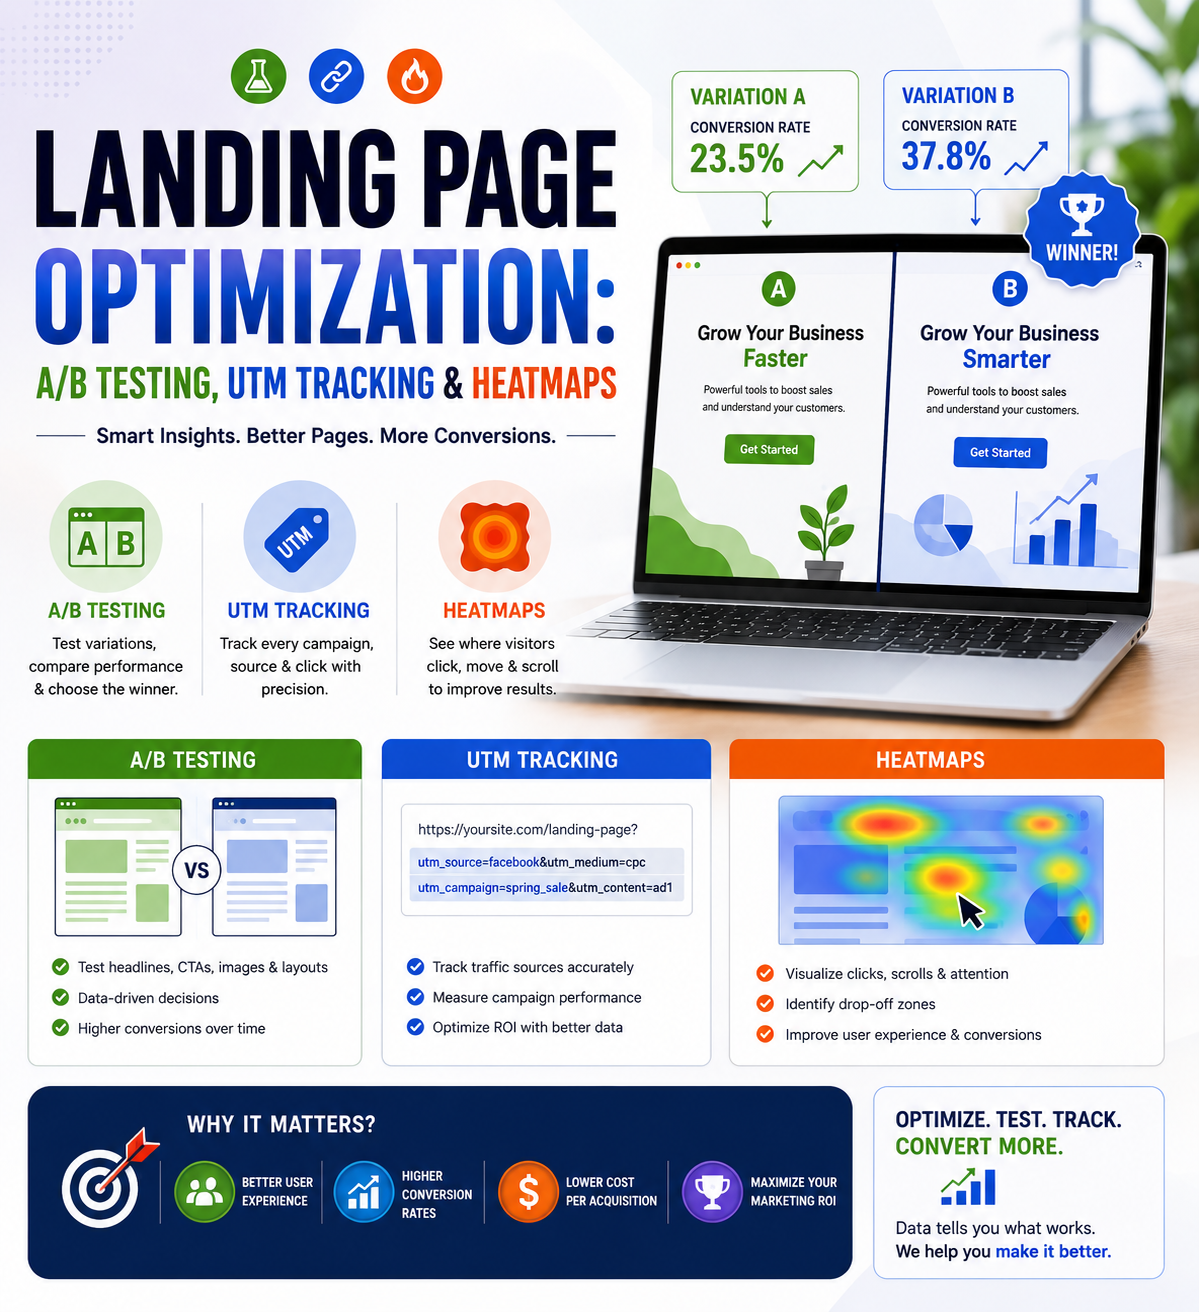
A/B testing (also called split testing) shows two versions of a page — a control (A) and a variant (B) — to different segments of your traffic simultaneously, then measures which version performs better against a defined conversion goal. The key word is simultaneously — testing version A in January and version B in February isn’t a valid A/B test, since seasonal, market, and traffic-source variables confound the comparison.
What to Test First
Not all page elements have equal impact on conversion rate. Prioritize testing:
- Headline — often the single highest-leverage element, since it’s the first thing visitors read and directly affects whether they continue engaging
- Call-to-action (CTA) copy and placement — “Get Started” versus “Book a Free Demo” can meaningfully change click-through behavior depending on your audience’s stage in the buying process
- Hero image or video — visual-first impressions strongly influence perceived credibility and relevance
- Form length — reducing form fields generally increases conversion rate, though it can reduce lead quality; the right tradeoff depends on your sales process
- Social proof placement — testimonials, logos, and trust badges, and where on the page they appear relative to the CTA
Running a Statistically Valid Test
A common mistake is ending a test too early based on an apparent early lead for one variant. Valid A/B testing requires:
- Sufficient sample size — calculated in advance based on your current conversion rate and the minimum effect size you want to detect
- A full business cycle of data — running a test for at least one full week (ideally two) accounts for day-of-week variation in traffic behavior
- One variable at a time (in true A/B testing) — testing multiple changed elements simultaneously (multivariate testing) requires substantially more traffic to reach statistical significance and separate which change actually drove the result
Tools for A/B Testing Landing Pages
Common platforms include Google Optimize alternatives like VWO and Optimizely for enterprise-scale testing, along with built-in split testing tools inside landing page builders like Unbounce and Instapage, which are often more accessible for smaller marketing teams without dedicated CRO resources.
UTM Tracking: Understanding Where Conversions Come From
What UTM Parameters Are
UTM (Urchin Tracking Module) parameters are tags added to the end of a URL that tell your analytics platform exactly where a visitor came from — which campaign, source, and medium drove the click. Without UTM tracking, traffic from different campaigns often gets lumped together under generic “referral” or “direct” traffic in analytics, making it impossible to attribute conversions to specific marketing efforts accurately.
The Five Standard UTM Parameters
- utm_source — the specific platform or publisher (e.g., facebook, newsletter, google)
- utm_medium — the marketing channel type (e.g., cpc, email, social)
- utm_campaign — the specific campaign name (e.g., spring_sale_2026)
- utm_term — used for paid search to track specific keywords (optional)
- utm_content — used to differentiate between multiple ads or links within the same campaign (optional, useful for A/B testing ad creative)
Building a UTM Naming Convention
Without a consistent naming convention, UTM data becomes unusable for reporting — inconsistent capitalization, spacing, or naming (e.g., Spring_Sale vs spring-sale vs springsale) fragments what should be unified campaign data across your analytics platform. Establish and document a strict naming convention (lowercase, consistent separators, defined campaign naming structure) before your team starts creating UTM links at scale, and consider using a shared spreadsheet or dedicated UTM builder tool to enforce consistency.
Common UTM Tracking Mistakes
- Inconsistent naming fragmenting campaign data in reporting
- Missing UTMs on some channels but not others, creating incomplete attribution pictures
- Overwriting UTM parameters when links are shared or forwarded, losing original attribution
- Not connecting UTM data to downstream conversion, tracking clicks but not tying that data through to actual leads or sales in your CRM
Heatmap Tools: Understanding Visitor Behavior
What Heatmaps Reveal
Heatmap tools visually represent aggregate visitor behavior on a page — where people click, how far they scroll, and where their mouse movement (often used as a proxy for attention) concentrates. This behavioral data reveals problems that conversion rate numbers alone don’t explain: a low-converting page might have a broken form, a CTA that’s assumed to be non-clickable, or critical content that most visitors never scroll far enough to see.
Types of Heatmap Data
- Click maps — show exactly where visitors click, including clicks on non-interactive elements, which often reveals user expectations that don’t match the actual page design
- Scroll maps — show what percentage of visitors reach each section of the page, revealing whether important content below the fold is actually being seen
- Move maps — track mouse movement as an attention proxy, useful for understanding which sections draw visual engagement even without clicks
- Session recordings — individual visitor session playback, useful for diagnosing specific usability issues that aggregate heatmap data alone might not fully explain
Using Heatmap Data to Drive Optimization Decisions
Heatmap data is most valuable when used to generate specific, testable hypotheses rather than as an end in itself. If scroll data shows most visitors never reach your pricing section, for example, that’s a hypothesis worth testing directly — either by moving pricing information higher on the page or by testing whether pricing needs to be on the landing page at all.
Putting It Together: A Practical CRO Framework
- Diagnose with heatmaps and analytics first. Before testing blindly, understand where visitors are actually dropping off or getting confused.
- Form a specific hypothesis. “Moving the CTA above the fold will increase click-through rate because heatmap data shows 60% of visitors never scroll past the hero section” is testable; “let’s make the page better” is not.
- Prioritize tests by potential impact and effort. High-traffic pages with clear behavioral friction points should be prioritized over low-traffic pages where a test would take months to reach significance.
- Run one clean test at a time where possible, with a defined sample size and duration set in advance.
- Document results regardless of outcome. A test that shows no significant difference is still useful data — it rules out that variable as a priority for future optimization.
- Build a testing roadmap, not a single one-off test. Continuous, systematic optimization compounds meaningfully over time compared to occasional isolated tests.
Frequently Asked Questions
How long should an A/B test run? At minimum one full week to account for day-of-week traffic variation, and ideally until you’ve reached your pre-calculated required sample size for statistical significance — ending a test early based on an apparent early lead is one of the most common CRO mistakes.
What’s a good landing page conversion rate? Conversion rate benchmarks vary enormously by industry, traffic source, and offer type, so comparing your page to generic published benchmarks is less useful than tracking your own page’s improvement over time through systematic testing.
Do I need UTM parameters if I’m already using Google Analytics? Yes. Google Analytics can automatically detect some traffic sources, but UTM parameters are necessary for accurate, granular attribution of specific campaigns, ads, or content pieces — without them, much of your traffic gets grouped into generic source categories that don’t support campaign-level reporting.
What’s the difference between a heatmap and session recording? A heatmap shows aggregate behavior across many visitors (where clicks, scrolling, and attention concentrate on average), while a session recording shows the actual individual browsing session of a single visitor — both are useful, with heatmaps better for spotting broad patterns and session recordings better for diagnosing specific usability issues.
Can I run an A/B test on a low-traffic landing page? It’s possible, but low-traffic pages take proportionally longer to reach statistical significance, sometimes making testing impractical within a reasonable timeframe. For low-traffic pages, qualitative methods (heatmaps, session recordings, user feedback) are often more immediately useful than formal split testing.
What tools are best for landing page A/B testing? Dedicated landing page builders like Unbounce and Instapage include built-in split testing tools that are accessible for marketing teams without engineering resources, while platforms like VWO and Optimizely offer more advanced testing capability often used by larger organizations with dedicated CRO teams.