
Businesses today are drowning in data. Sales figures climb, customer interactions multiply, and every click, call, and transaction gets logged somewhere in a system. Yet many teams still lean on gut feeling when making decisions, even though data-driven companies are consistently more productive and profitable overall. That gap between instinct and insight is where performance analytics steps in.
Performance analytics helps you connect the dots between effort and outcomes. It shows you what’s working, what’s not, and what to do next. Instead of guessing, you get clarity. Instead of arguing opinions, you discuss facts. Let’s break it down in plain language and walk through how you can actually use it in your business.
What Is Performance Analytics?
Performance analytics is the process of measuring, analysing, and interpreting data to understand how well a business, system, or team is performing over time. It is less about spreadsheets and more about answering very practical questions, such as:
Are we meeting our goals?
What’s driving our results?
Where are we wasting time or money?
Unlike opinion-based reviews, performance analytics depends on facts, not assumptions. It tracks activities, compares them against targets, and highlights patterns that are easy to miss in day-to-day operations. The core goal is simple: improvement. When teams see accurate insights, they can act with confidence instead of guesswork.
You can apply performance analytics almost anywhere: operations, finance, sales, HR, marketing, IT, and digital platforms. The context changes, but the principle stays the same — use data to make better decisions.
Why Performance Analytics Matters Today
Business moves fast. Customer expectations shift, competitors react, and costs rise or fall in ways you can’t always predict. In that kind of environment, running on instinct alone is like driving in fog without headlights.
Here’s why performance analytics has become so important:
It replaces assumptions with evidence, helping leaders make faster, more confident decisions.
It cuts through noise so teams focus on the metrics that actually support business goals instead of chasing vanity numbers.
It makes performance visible, making it easier to hold people and processes accountable without micromanaging.
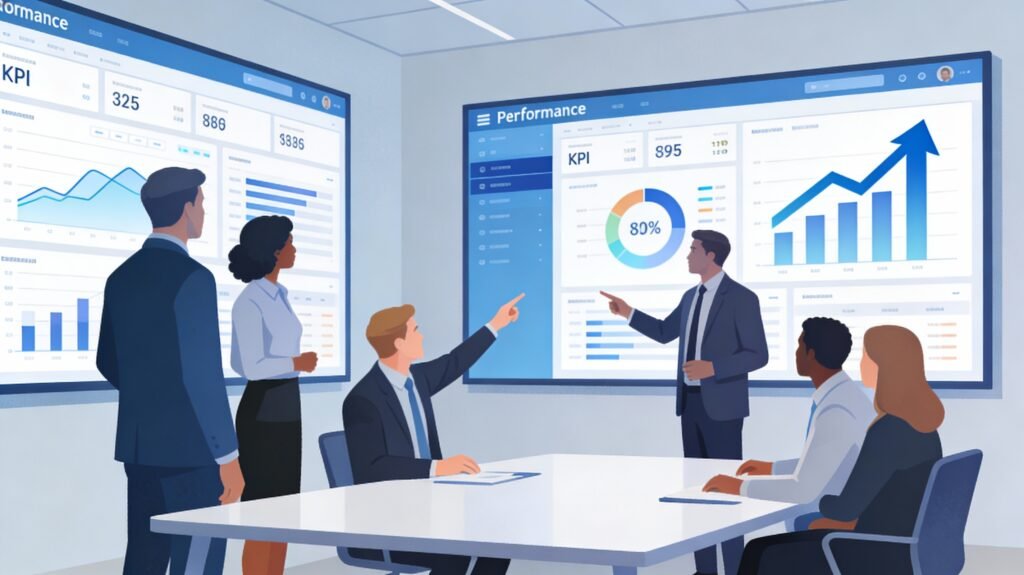
When everyone can see what’s happening in real time, conversations shift from “I think” to “The data shows”. That shift alone can transform how a company runs.
Core Objectives of Performance Analytics
So what is performance analytics really trying to achieve? Under all the charts and dashboards, there are a few clear objectives.
Visibility: Give leaders and teams a clear picture of where performance stands right now and how far they are from their goals.
Alignment: Make sure daily activities actually support long-term strategy, so people aren’t busy but misaligned.
Continuous improvement: Identify strengths, gaps, and opportunities so teams can keep getting better instead of repeating the same mistakes.
Risk reduction: Spot issues early — whether in operations, finance, or customer experience — before they turn into bigger problems.
Think of performance analytics as a flashlight and a compass: it shows you where you are and helps you move in the right direction, step by step.
How Performance Analytics Actually Works
At a high level, performance analytics follows a simple loop: collect, analyse, interpret, act, and repeat. Here’s what that looks like in practice.
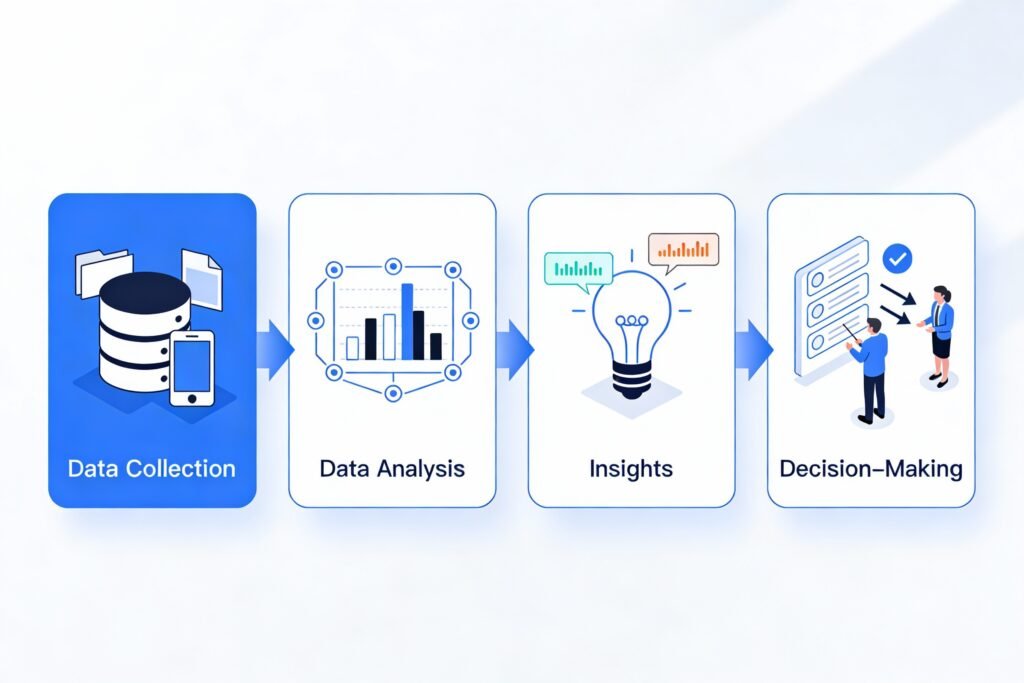
Collect data from multiple sources
Businesses pull data from systems like CRMs, ERPs, HR tools, website analytics, finance platforms, and operational systems. This might include:Sales figures
Customer interactions
Financial records
Operational logs and service tickets
Process and analyse the data
Using analytics tools, dashboards, and statistical techniques, raw numbers are cleaned, combined, and visualised so patterns and relationships become visible.Interpret the results
Analysts and managers review the outputs to identify key performance indicators (KPIs), track progress, and understand what’s driving change — both positive and negative.Take action based on insights
The goal is not just to create reports but to change behaviour: adjust pricing, refine processes, retrain teams, invest in certain channels, or fix bottlenecks.Monitor and refine continuously
Performance analytics is not a one-time project. It’s a continuous cycle where new data feeds back into the system so strategies can evolve with the market and customer needs.
Over time, this loop helps companies turn their data from a passive archive into an active strategic asset.
Types of Performance Analytics (And How They Work Together)
Performance analytics is not just one thing. It blends several analytics types that each answer a different question about your business.
Descriptive Analytics: What Happened?
Descriptive analytics looks at historical data and summarises it into reports, charts, and dashboards.
It answers questions like “What were last quarter’s sales?” or “How many support tickets did we close?”
It’s your starting point for understanding past performance before digging deeper.
Think of it as reading your business’s “report card”.
Diagnostic Analytics: Why Did It Happen?
Diagnostic analytics goes one step further. It looks for reasons behind performance changes.
It connects data points to explain drops or spikes: “Why did sales fall in one region?” or “Why did churn increase?”
It often uses techniques like segmentation, correlation analysis, and drill-down views.
This is where you stop guessing and start uncovering root causes.
Predictive Analytics: What Might Happen Next?
Predictive analytics uses historical data and patterns to forecast future outcomes.
It can estimate future demand, sales trends, or customer churn.
It relies on statistical models and machine learning to generate probabilities, not guarantees.
Imagine it as a “data-powered crystal ball” that helps you prepare for what’s likely ahead.
Prescriptive Analytics: What Should We Do?
Prescriptive analytics goes from prediction to recommendation.
It suggests the best actions to take based on predicted outcomes.
It evaluates different scenarios and helps you choose options that optimise results, like the best pricing or inventory strategy.
Think of it as having a smart GPS for your business decisions: not just showing traffic, but telling you the best route.
Advanced and Real-Time Analytics
Some businesses go even further with more sophisticated approaches:
Advanced analytics uses complex models and large data sets to uncover deeper insights that basic reporting might miss, especially in large or data-heavy organisations.
Real-time analytics provides live visibility into performance so teams can act immediately — crucial in fast-moving environments like e-commerce, logistics, or financial trading.
When combined, these analytics types tell a full story: what happened, why it happened, what might happen next, and what you should do about it.
Key Performance Indicators (KPIs) That Power Analytics
KPIs are the backbone of performance analytics. They are the specific metrics used to track progress and signal whether things are on or off track.
Why KPIs matter so much:
They give a clear, simple way to measure progress and spot weak spots.
They align employee and organisational goals because people know exactly what success looks like.
They support a high-performance culture when tied to recognition, rewards, and development.
Common KPIs used in performance analytics include:
Revenue: Total money earned over a specific period.
Profit: Money left after subtracting costs from revenue.
Customer satisfaction: How happy customers are with products or services, often measured through surveys or ratings.
Employee satisfaction: How positively employees view their work and organisation.
Productivity: How efficiently a company turns resources (time, money, people) into output.
The key is not to track everything, but to pick a focused set of KPIs that reflect your strategy and outcomes that truly matter.
Major Benefits of Performance Analytics
Done right, performance analytics becomes one of the most valuable tools in a business. It moves you from “We think” to “We know”. Here are some of the biggest benefits.
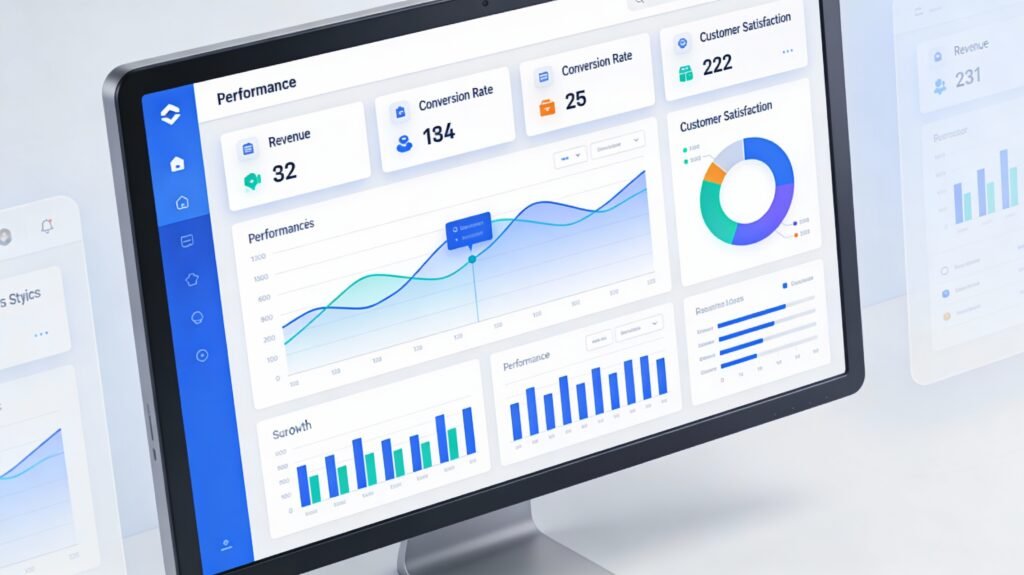
Improved Visibility Across Operations
Performance analytics pulls data from different systems into unified, easy-to-read dashboards.
Managers can see how teams, processes, and systems are performing in near real time.
It becomes easier to spot what’s working well and where bottlenecks or failures are happening.
Visibility is the first step to effective control.
Stronger Data-Driven Decisions
When decisions are based on accurate data instead of hunches, outcomes typically improve.
Leaders can see trends, behaviours, and cause–effect relationships clearly.
This reduces expensive trial-and-error and minimises bias in decision-making.
In a competitive market, better and faster decisions are a real edge.
Higher Operational Efficiency
Analytics helps identify inefficiencies, waste, and slow points across workflows.
You can streamline processes, reduce delays, and optimise use of people and resources.
Many companies use analytics to cut costs while maintaining or improving service quality.
It’s like tuning an engine so every part runs smoothly.
Stronger Accountability and Performance Tracking
When metrics are transparent, expectations are clearer.
Teams know what they’re being measured on and how they’re performing.
Leaders can evaluate performance fairly using consistent, objective metrics.
This often leads to more responsibility, better focus, and less blame-shifting.
Support for Continuous Improvement
Ongoing monitoring allows businesses to adjust strategies based on what the data shows, not months later when results are already locked in.
Feedback loops help refine processes, products, and programs.
Performance becomes a journey of steady improvement instead of periodic firefighting.
Over time, small, data-backed adjustments compound into major gains.
Better Alignment With Business Goals
When metrics line up with strategy, every department pulls in the same direction.
People understand how their work contributes to top-level goals.
Cross-functional communication improves because teams share a common language of KPIs and targets.
This alignment often separates average performers from high-performing organisations.
Faster Response to Change
Analytics helps you spot changes in performance early, whether in market trends, customer behaviour, or internal operations.
You can pivot quickly instead of reacting late.
This agility is crucial in fast-moving industries where timing can make or break results.
In short, performance analytics turns change into an opportunity rather than a threat.
Common Challenges in Performance Analytics
Of course, performance analytics is not magic. There are real challenges that can limit its impact if not addressed.
Data quality issues: Incomplete, inconsistent, or inaccurate data leads to misleading conclusions.
Poor integration: Data locked in separate systems and formats makes it hard to get a complete picture.
Skill gaps: Without basic data literacy, teams may misinterpret results or ignore insights.
Cultural resistance: Shifting from intuition-based to data-driven decisions can feel threatening and requires strong leadership support.
The good news? With better tools, training, and clear communication about the “why”, most of these barriers can be overcome.
Performance Analytics vs Performance Appraisals
People often confuse performance analytics with performance appraisals, but they’re very different tools serving different goals.
| Aspect | Performance Analytics | Performance Appraisals |
|---|---|---|
| Focus | Business processes, systems, and outcomes | Individual employee performance |
| Purpose | Improve efficiency, results, and decision-making | Evaluate contribution, give feedback, and plan development |
| Data source | Operational, financial, and system data | Manager feedback, self-assessments, performance records |
| Frequency | Continuous or real-time | Periodic (often annual or quarterly) |
| Approach | Data-driven and objective | Often subjective and review-based |
| Outcome | Insights for strategy and process improvement | Ratings, feedback, promotions, or development plans |
Both matter, but performance analytics looks at the health of the business machine, while appraisals focus on the people operating it.
Traditional Reviews vs Modern Performance Analytics
Traditional performance reviews tend to be slow, opinion-heavy, and backward-looking. Performance analytics flips that model.
| Aspect | Traditional Performance Review | Performance Analytics |
|---|---|---|
| Evaluation timing | Periodic (e.g., annually) | Continuous monitoring |
| Basis of assessment | Subjective opinions | Data-driven insights |
| Focus | Past performance | Ongoing performance trends and future impact |
| Accuracy | Prone to bias and memory gaps | More objective and consistent |
| Decision support | Limited | Strong and actionable |
| Improvement approach | Reactive | Proactive and ongoing |
Modern organisations increasingly combine both: continuous, analytics-driven visibility plus structured, human-centred conversations.
How to Execute Performance Analytics Step by Step
Implementing performance analytics doesn’t have to be overwhelming. A structured approach helps.
Set clear objectives
Decide exactly what you want to improve: productivity, engagement, cost control, customer satisfaction, or goal alignment. Clear goals filter out irrelevant metrics.Choose the right KPIs
Pick meaningful, measurable KPIs that reflect these goals — not just what’s easy to track.Collect and integrate data
Pull data from reports, systems, surveys, and feedback into a central environment. Make sure it’s accurate, consistent, and well-structured.Build dashboards and reports
Use simple, visual dashboards so teams can understand trends at a glance and act faster.Benchmark and compare
Compare performance over time and against industry standards to see where you stand and where you can improve.Run root cause analysis
When something changes, dig into “why” using techniques like the five whys, segmentation, or drill-down analysis.Analyse performance drivers
Combine hard numbers with team feedback to understand what truly drives performance, not just symptoms.Spot trends and patterns
Look for recurring patterns in performance data — these often explain sudden changes or long-term shifts.Plan and implement actions
Turn insights into clear action plans with owners, timelines, and success metrics. Track progress visibly.Maintain continuous feedback
Encourage open communication so teams can question data, share context, and refine strategies over time.
This cycle keeps performance analytics practical and tightly connected to daily work.
Popular Tools Used for Performance Analytics
The tools you use can make or break your analytics efforts. Here are some widely used platforms and how they fit in.
ServiceNow Performance Analytics
ServiceNow Performance Analytics helps organisations measure, monitor, and improve service and operational performance.
It tracks workflows, service delivery, and process efficiency using KPIs and real-time dashboards.
Teams can monitor trends over time, identify gaps, and take corrective action early, which supports continuous improvement and better resource management.
SAP SuccessFactors
SAP SuccessFactors focuses on workforce and human capital analytics.
It helps track employee productivity, engagement, performance, and goal alignment.
By linking individual results to business objectives, it improves talent management and organisational effectiveness.
Salesforce
Salesforce is widely used for sales and customer performance analytics.
It consolidates data from customer interactions and touchpoints and presents them via reports and dashboards.
Businesses use it to track pipelines, conversion rates, customer behaviour, and revenue trends, refining strategies and boosting customer relationships.
NetApp
NetApp supports performance analytics at the infrastructure and data management layer.
It monitors system performance, storage usage, and data availability.
Early detection of performance issues helps maintain system reliability and keep digital platforms running smoothly.
Microsoft Dynamics 365 Finance
Microsoft Dynamics 365 Finance provides deep insight into financial performance.
It tracks revenue, expenses, cash flows, and broader financial health.
Accurate financial analytics help leaders align budgets with strategy and support stable, sustainable growth.
In practice, most organisations use a mix of such tools connected through integrated data pipelines.
Real-World Use Cases of Performance Analytics
Performance analytics is not theoretical — it’s already embedded in how many teams operate.
Sales analytics: Track revenue growth, conversion rates, win/loss ratios, and pipeline health to refine sales strategies and improve forecasting.
Supply chain and operations: Monitor inventory levels, delivery times, and supplier performance to reduce costs and improve reliability.
Website and digital analytics: Track page speed, traffic patterns, and engagement metrics to enhance user experience and conversion rates.
Across these areas, the common thread is the same: data guides improvement and supports better business outcomes.
Final Thoughts
Performance analytics gives businesses what they need most in a noisy world: clarity. It turns raw data into meaningful insight, replacing guesswork with evidence and helping leaders make smarter, faster decisions. When used consistently, it becomes more than a reporting function — it becomes a long-term competitive advantage.
Teams align around shared goals. Leaders act with greater confidence. Over time, results improve across departments: sales, operations, finance, HR, and IT. Investing in performance analytics today is not just about tracking numbers; it is about building a stronger, more resilient business for the future.